 |
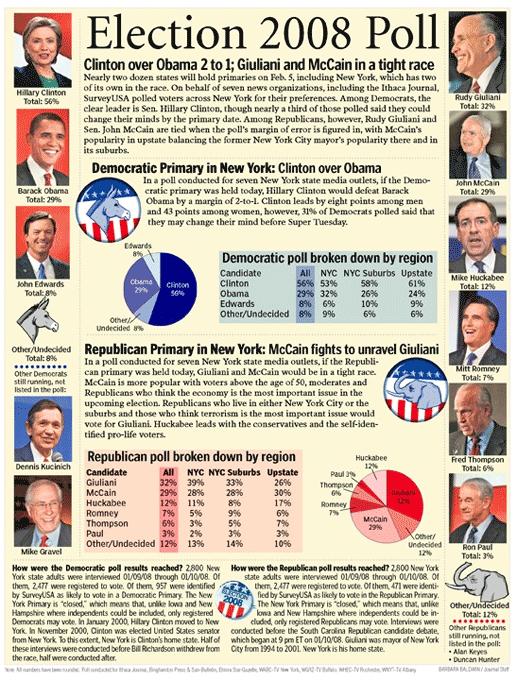
Explanatory Journalism: I used graphics, charts, and photos to visualize polling data from New York state voters from January 10, 2008.
 |
Explanatory Journalism: I used graphics, charts, and photos to visualize polling data from New York state voters from January 10, 2008.